
Asset manager social engagement: YouTube slumps in Q3 2026
Key takeaways
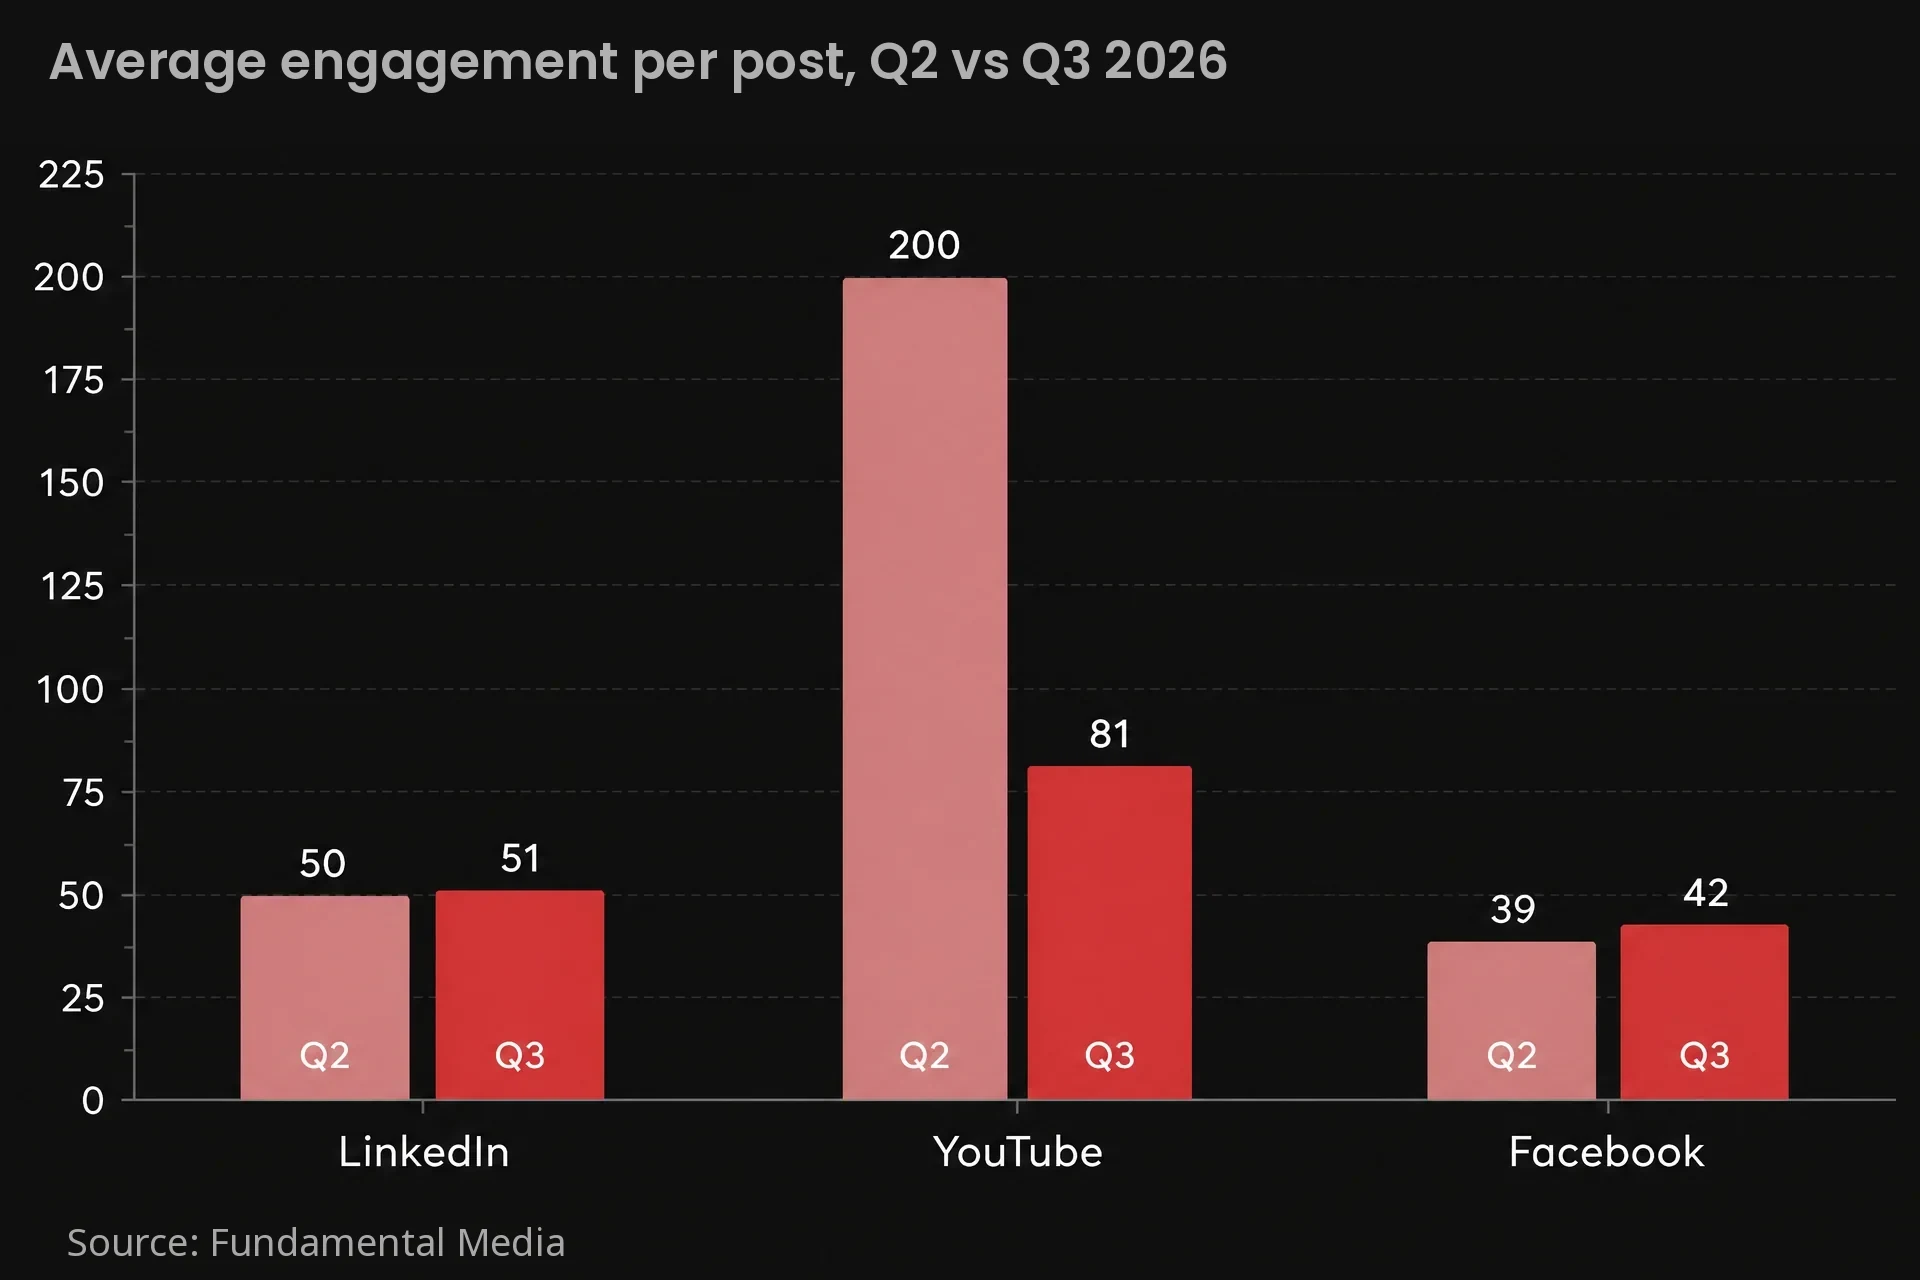
- Average YouTube engagement per video post across 40 leading asset managers fell by more than half between Q2 and Q3 2026, according to Fundamental Group data.
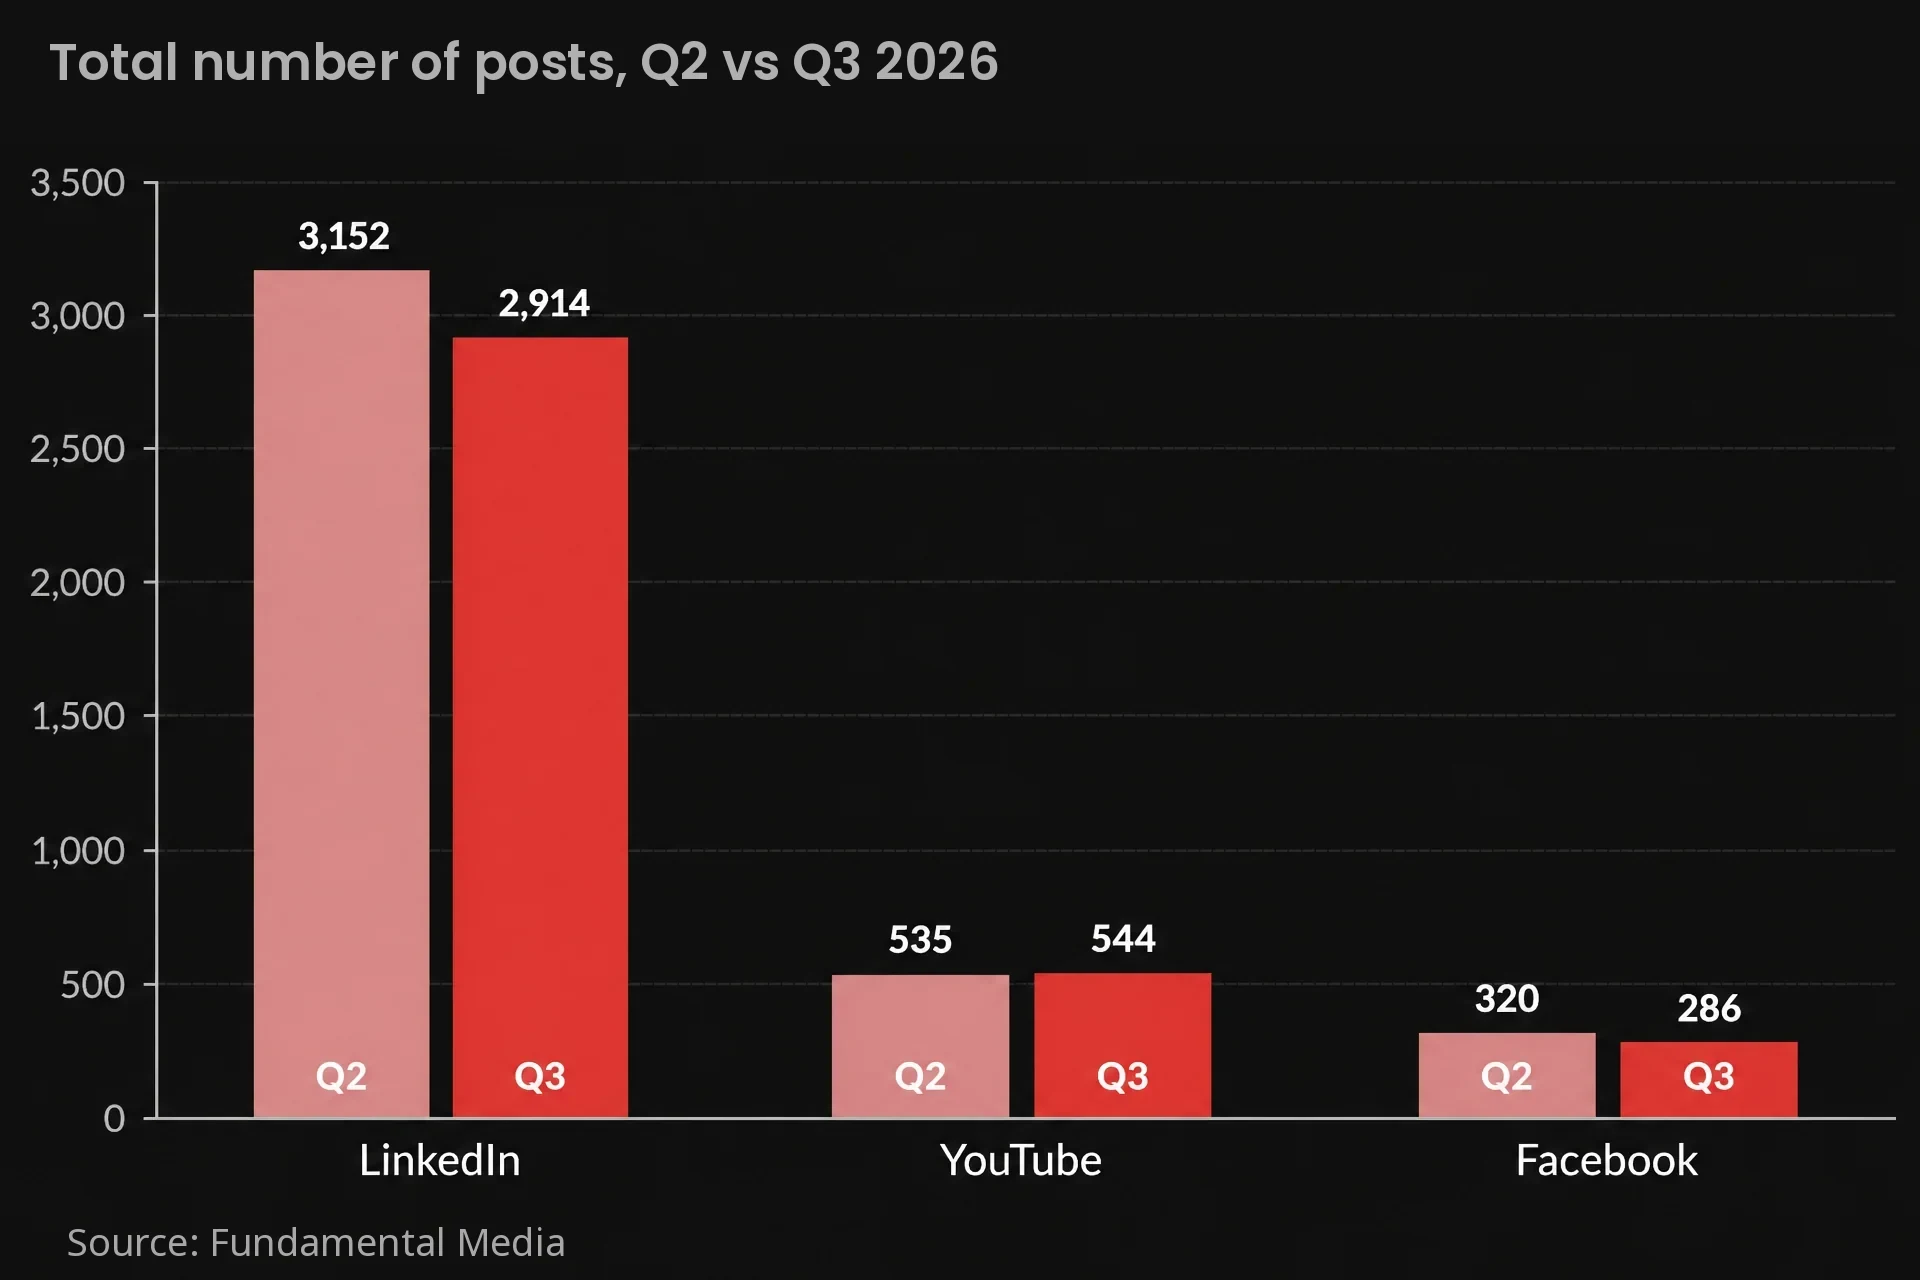
- However, YouTube post numbers held steady quarter on quarter, while LinkedIn and Facebook output slipped by 8% and 11%.
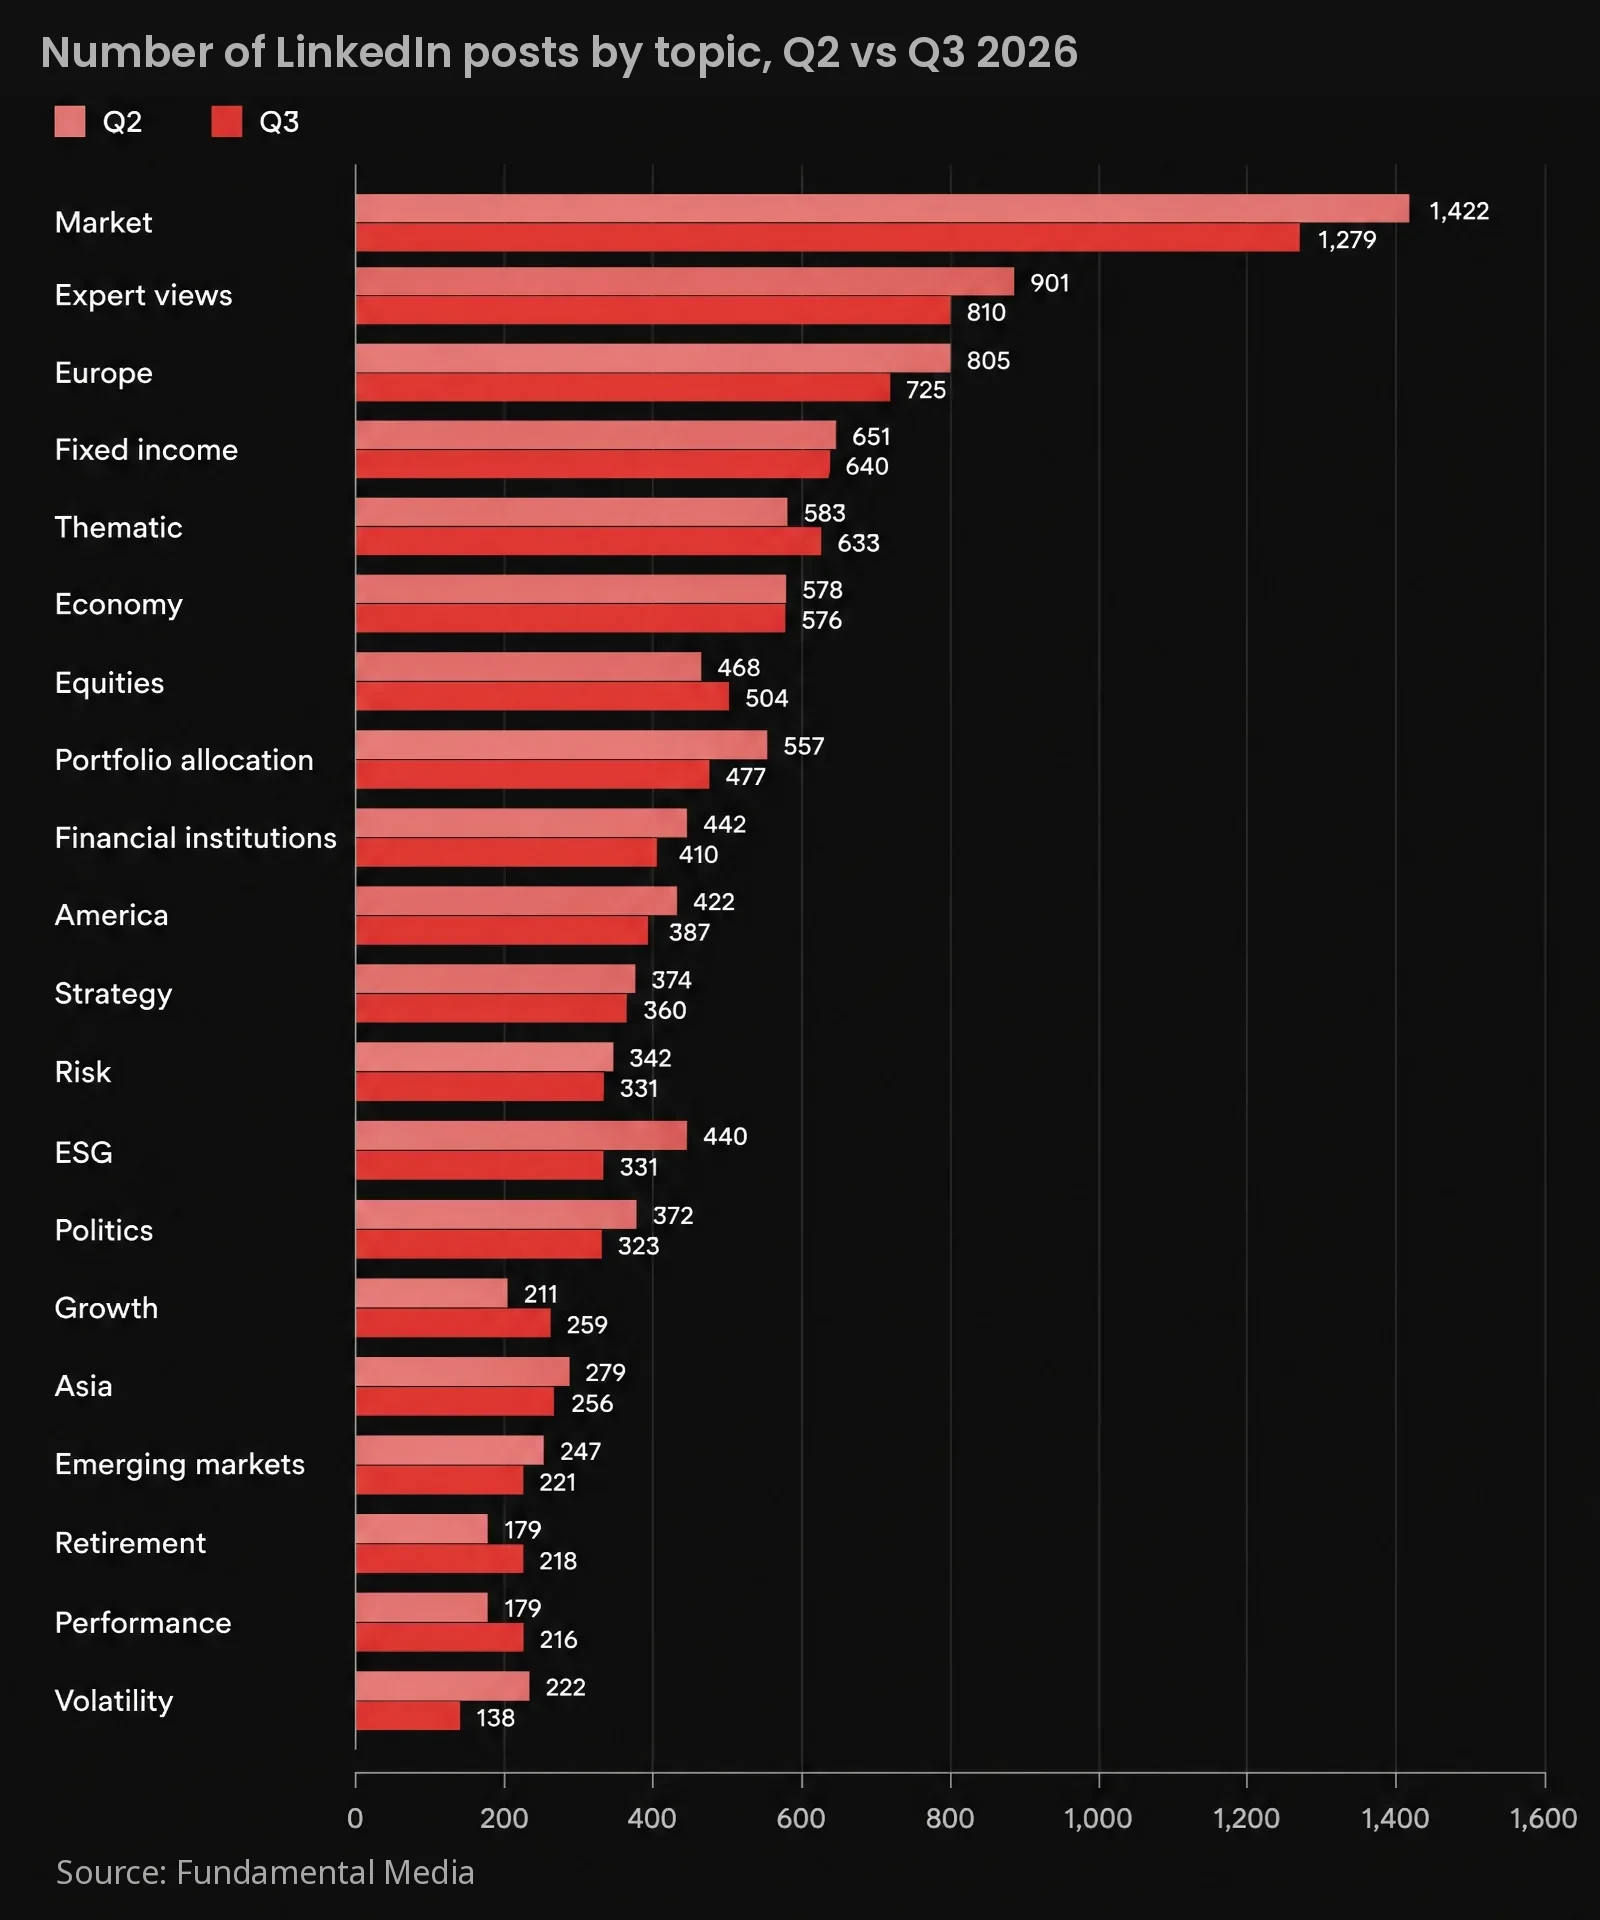
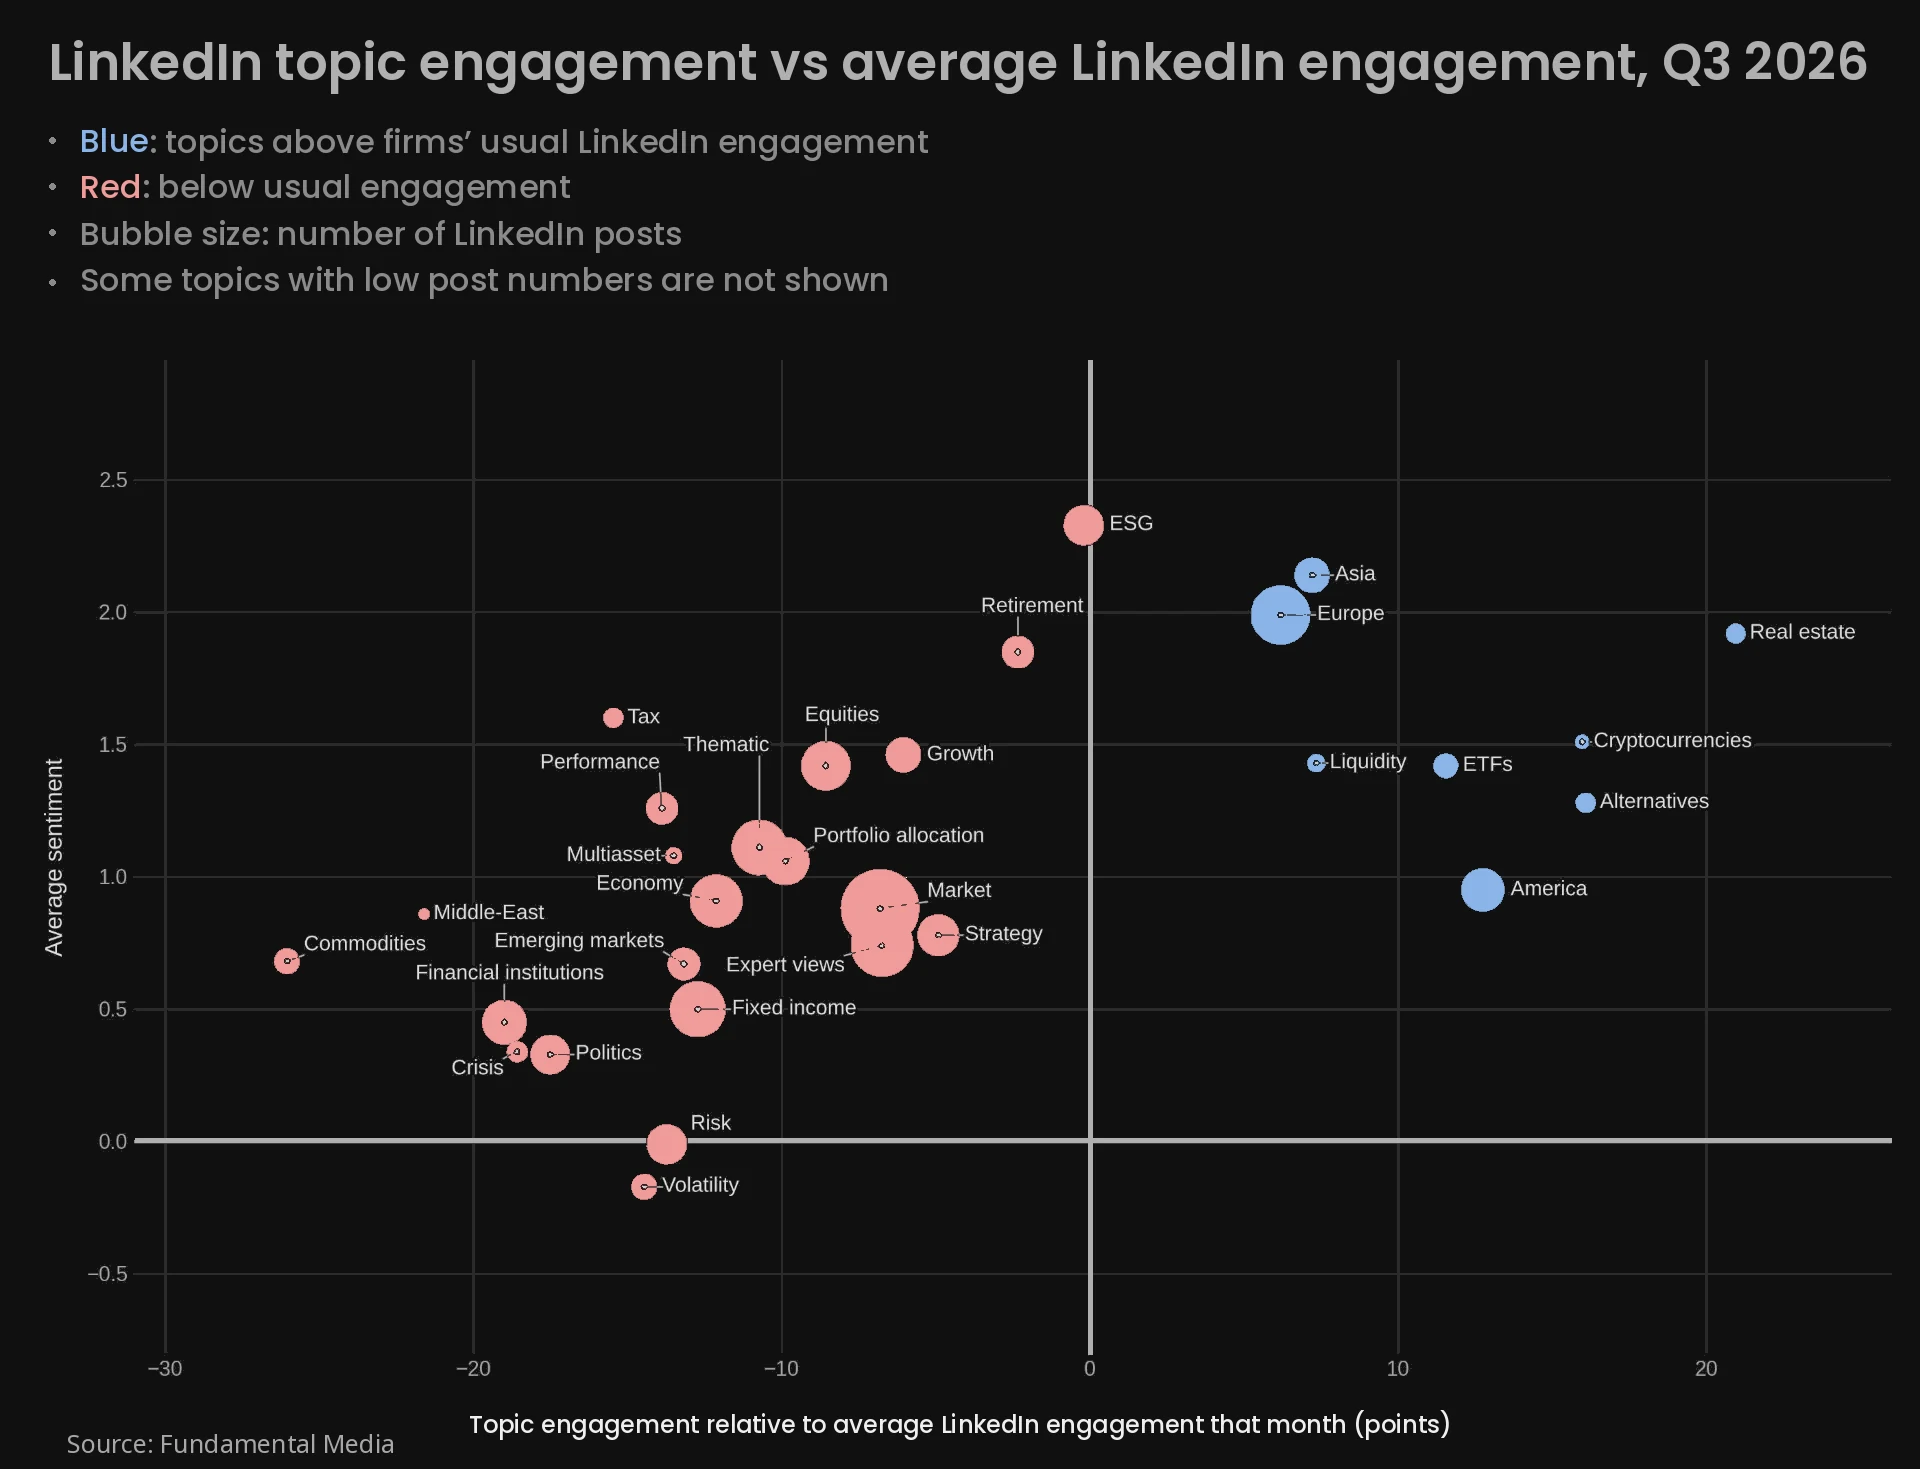
- “Market” remained the most posted-about LinkedIn topic, while real estate, alternatives, cryptocurrencies and ETFs earned above-average engagement from modest post volumes.
Average YouTube engagement per video post fell by more than half between Q2 and Q3 while LinkedIn and Facebook held broadly steady, according to Fundamental Media’s analysis of asset manager social media engagement and posting activity across 40 leading firms.
Across all regions, asset manager YouTube posts averaged 200 engagements in Q2 against 81 in Q3, while LinkedIn barely moved, from 50 to 51, and Facebook edged up from 39 to 42. Although the Q2 YouTube figure was lifted by a handful of exceptionally high-performing posts, the average still fell by about a third when the five most engaging posts in each quarter are excluded.
Asset managers published 3,744 posts across the three platforms in Q3. In this analysis, asset manager social media engagement counts the likes, clicks, video views, shares and comments a post received.
YouTube engagement per post rose from 65 in July to 112 in August, despite the northern hemisphere summer holidays, then settled at 72 in September. LinkedIn edged up from 48 to 56 over the quarter, while Facebook peaked at 55 in August before easing to 41.
Post numbers held steady on YouTube but slipped on LinkedIn and Facebook
Even as YouTube engagement fell, posting on the platform actually held steady, with asset managers publishing 544 YouTube posts in Q3 against 535 in Q2. LinkedIn and Facebook output slipped by 8% and 11% respectively, though LinkedIn still accounted for more than three-quarters of all posts.
August was the quietest month of Q3 for LinkedIn, with 783 posts against 1,105 in July, its lowest monthly total of the year, before output recovered to 1,026 in September. YouTube ended the quarter at its highest monthly total of 2026, while Facebook posting declined steadily across the three months.
Which LinkedIn topics did asset managers post about most?
For LinkedIn, Fundamental also analyses which subjects asset managers focus on, tagging each post with one or more topics.
The topic mix held steady between quarters. “Market” remained the most posted-about theme across the asset managers tracked, with 1,279 posts in Q3, ahead of “Expert views” with 810 and “Europe” with 725, though each was down around 10% on Q2, broadly in line with the fall in LinkedIn posting overall. Growth, retirement and performance each rose by more than 20% on Q2, though from small bases.
LinkedIn topics that earned above-average engagement in Q3 2026
The chart below compares how each LinkedIn topic performed with the average engagement the same asset manager earned across all its LinkedIn posts that month. Topics further right beat that average, and topics higher up carried a more positive tone.
Real estate, alternatives, cryptocurrencies and ETFs all beat that average with positive sentiment, albeit from modest volumes of 43 to 124 posts, while commodities trailed furthest behind. Most topics, including the most-posted themes “Market” and “Expert views”, fell slightly short of it.
Which asset manager posts drew the most engagement in Q3 2026?
The two LinkedIn posts that drew the most engagement were both commemorations rather than business announcements. J.P. Morgan Asset Management’s Fourth of July tribute to the 250th anniversary of the United States, featuring snapshots from its employees, led with 2,484 engagements in July. A first-person Vanguard post reflecting on the 25th anniversary of September 2001 followed with 1,710 in September.
The YouTube video that drew the most engagement was a Fidelity podcast episode on the future of the UK State Pension triple lock, with around 3,960 engagements in September, while the Facebook post that drew the most was a Fidelity Investments prompt encouraging followers to add an extra dollar to their Roth IRA, with 1,422, also in September.

LinkedIn holds social lead for asset managers in Q2 2026
LinkedIn led social posting among 40 asset managers in Q2 2026, while YouTube engagement surged in May. Fundamental Media's quarterly data analysis.

LinkedIn dominates top 10 asset manager posts in Q1 2026
Fundamental Media analysed 3,696 posts from 40 asset managers in Q1 2026. See how LinkedIn dominated and which topics drove the highest engagement.

Social media activity rises among asset managers in Q4
Asset managers were more active on LinkedIn during Q4 2025, research by Fundamental Media shows